Public Policy Review

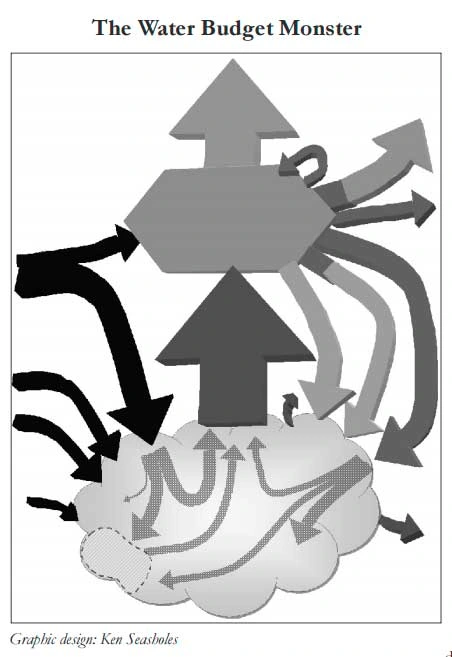
Recently, Ken Seasholes, Director of the Tucson Active Management Area, was a guest lecturer at the graduate seminar, Arizona Water Policy, which I teach with my colleague Kathy Jacobs. His was a formidable task, to discuss AMA water regulation and management plans, and he came armed with the “cartoon” pictured here. At first glance, it could be interpreted as someone’s idea of a multi-armed, scary monster. But, upon closer examination, the figure can be seen as an informative depiction of the groundwater aquifer and the factors to be considered when calculating the Tucson AMA’s water budget.
While space does not permit me to go into the detail Ken did, I am going to attempt an abbreviated explanation here. While the numeric example he provided along with the graphic was for the Tucson AMA, the principles apply generally.
The bottom of the cartoon represents the groundwater aquifer. The big arrow going up in the middle represents groundwater pumping. The hexagon above the pumping arrow represents regional demand, and the top arrow represents the actual consumptive use, or water not returning to the system.
The right hand side arrows represent what occurs to water after it is used but not fully consumed. The right hand arrows pointing to the aquifer represent the water that flows back into the groundwater system through the effluent system and through incidental recharge, as occurs when crops are irrigated, for example.
The arrows on the left going into the aquifer represent natural and artificial inputs. The former includes water flowing into the aquifer from stream beds and washes and mountain front recharge. One of the arrows represents groundwater underflow coming in from another basin. The biggest arrow coming in from the left and pointing into the aquifer represents recharge of CAP water. The top-most left arrow depicts delivery of CAP directly to users to meet their demands. Although direct delivery is not utilized to meet municipal demands in the Tucson AMA, it might be in the future.
The most complicated part of the water budget calculation likely relates to some of the arrows inside the aquifer. They show what happens to water that reaches the aquifer, whether from the left or right side. If that water is considered stored water pursuant to a storage permit, then various accounting rules come into play. The “bookkeeping” must consider cuts to the aquifer, annual storage and recovery, accrual of long-term storage credits, and credit recovery. The real challenge for me has been understanding how stored water figures into the official water budget. Long-term storage credits for water put into the system provide someone at some time with the right to pump water out of the aquifer. So, although water has been added to the aquifer through “artificial” recharge, it is off the books when considering the amount of overdraft.
For me an “epiphany” came with Ken’s explanation of his cartoon that, although the printed water budget with all the numbers shows a net artificial recharge number “above the line” indicating the amount of total overdraft, the recharged water subject to future withdrawal is not counted as an addition to groundwater. The 2003 draft water budget for the Tucson AMA shows over 163,000 acre feet of groundwater overdraft. While that year saw 56,919 of net artificial recharge, that stored water does not reduce the 2003 overdraft.
Ken’s explanation of his cartoon, coupled with the tables, makes it very clear why water stored for future use should be “off the books.” It is great that we are storing water, but we must not forget that it’s being stored so that it can be used in the future. The figures show, at least for Tucson, that we have a long way to go to meet our statutory safe-yield goal by 2025.

